


Although there are often complaints saying Rust’compilation speed is notoriously slow, our project RisingWave is not so slow to compile, especially since previously contributors like (skyzh, BugenZhao) have put in a lot of effort. After using an M1 MacBook Pro, compiling is not a problem at all. A full debug compilation only takes 2-3 minutes.
However, over time, more and more things have been added to our CI, making it increasingly bloated. The main workflow now takes about 40 minutes, while the PR workflow takes about 25 minutes 30 seconds. Although it is still not intolerably slow, it is already noticeably slower than before.
So a few days ago, I decided to spend some time researching whether I could optimize the compilation speed a bit more.
What shocked me was that there were some very simple methods that, with just a little effort, produced astonishing results. I feel like I can describe them as low-hanging fruits, silver bullets, or even free lunch 🤯.
P.S. I highly recommend matklad’s blog (He is the original author of IntelliJ Rust and rust-analyzer):
Most of the methods I used are discussed there, and he explains them clearly. If not otherwise indicated, all quotes in this article come from there.
Although there are quite some articles talking about how to optimize Rust compilation speed (e.g., Tips for Faster Rust Compile Times), I still want to write another one to share my step-by-step process. Each optimization point comes with a corresponding PR, and you can combine the commit history to see the effect of each optimization point by comparing the CI pages before and after its PR.
P.P.S. Results after optimization: main workflow is now 27 minutes at the fastest, and PR workflow is now 16 minutes at the fastest, with most taking around 17-19 minutes.
Valuable data and charts to find the bottlenecks
Build times are a fairly easy optimization problem: it’s trivial to get direct feedback (just time the build), there are a bunch of tools for profiling, and you don’t even need to come up with a representative benchmark.
When trying to optimize anything, it would be good to have some profiling data and charts to find out the bottlenecks. Luckily, we do have some nice ones for optimizing CI time.
CI Waterfall & DAG Graph
We use Buildkite for our CI, and the normal view of a page (such as Build #17099) looks like this:
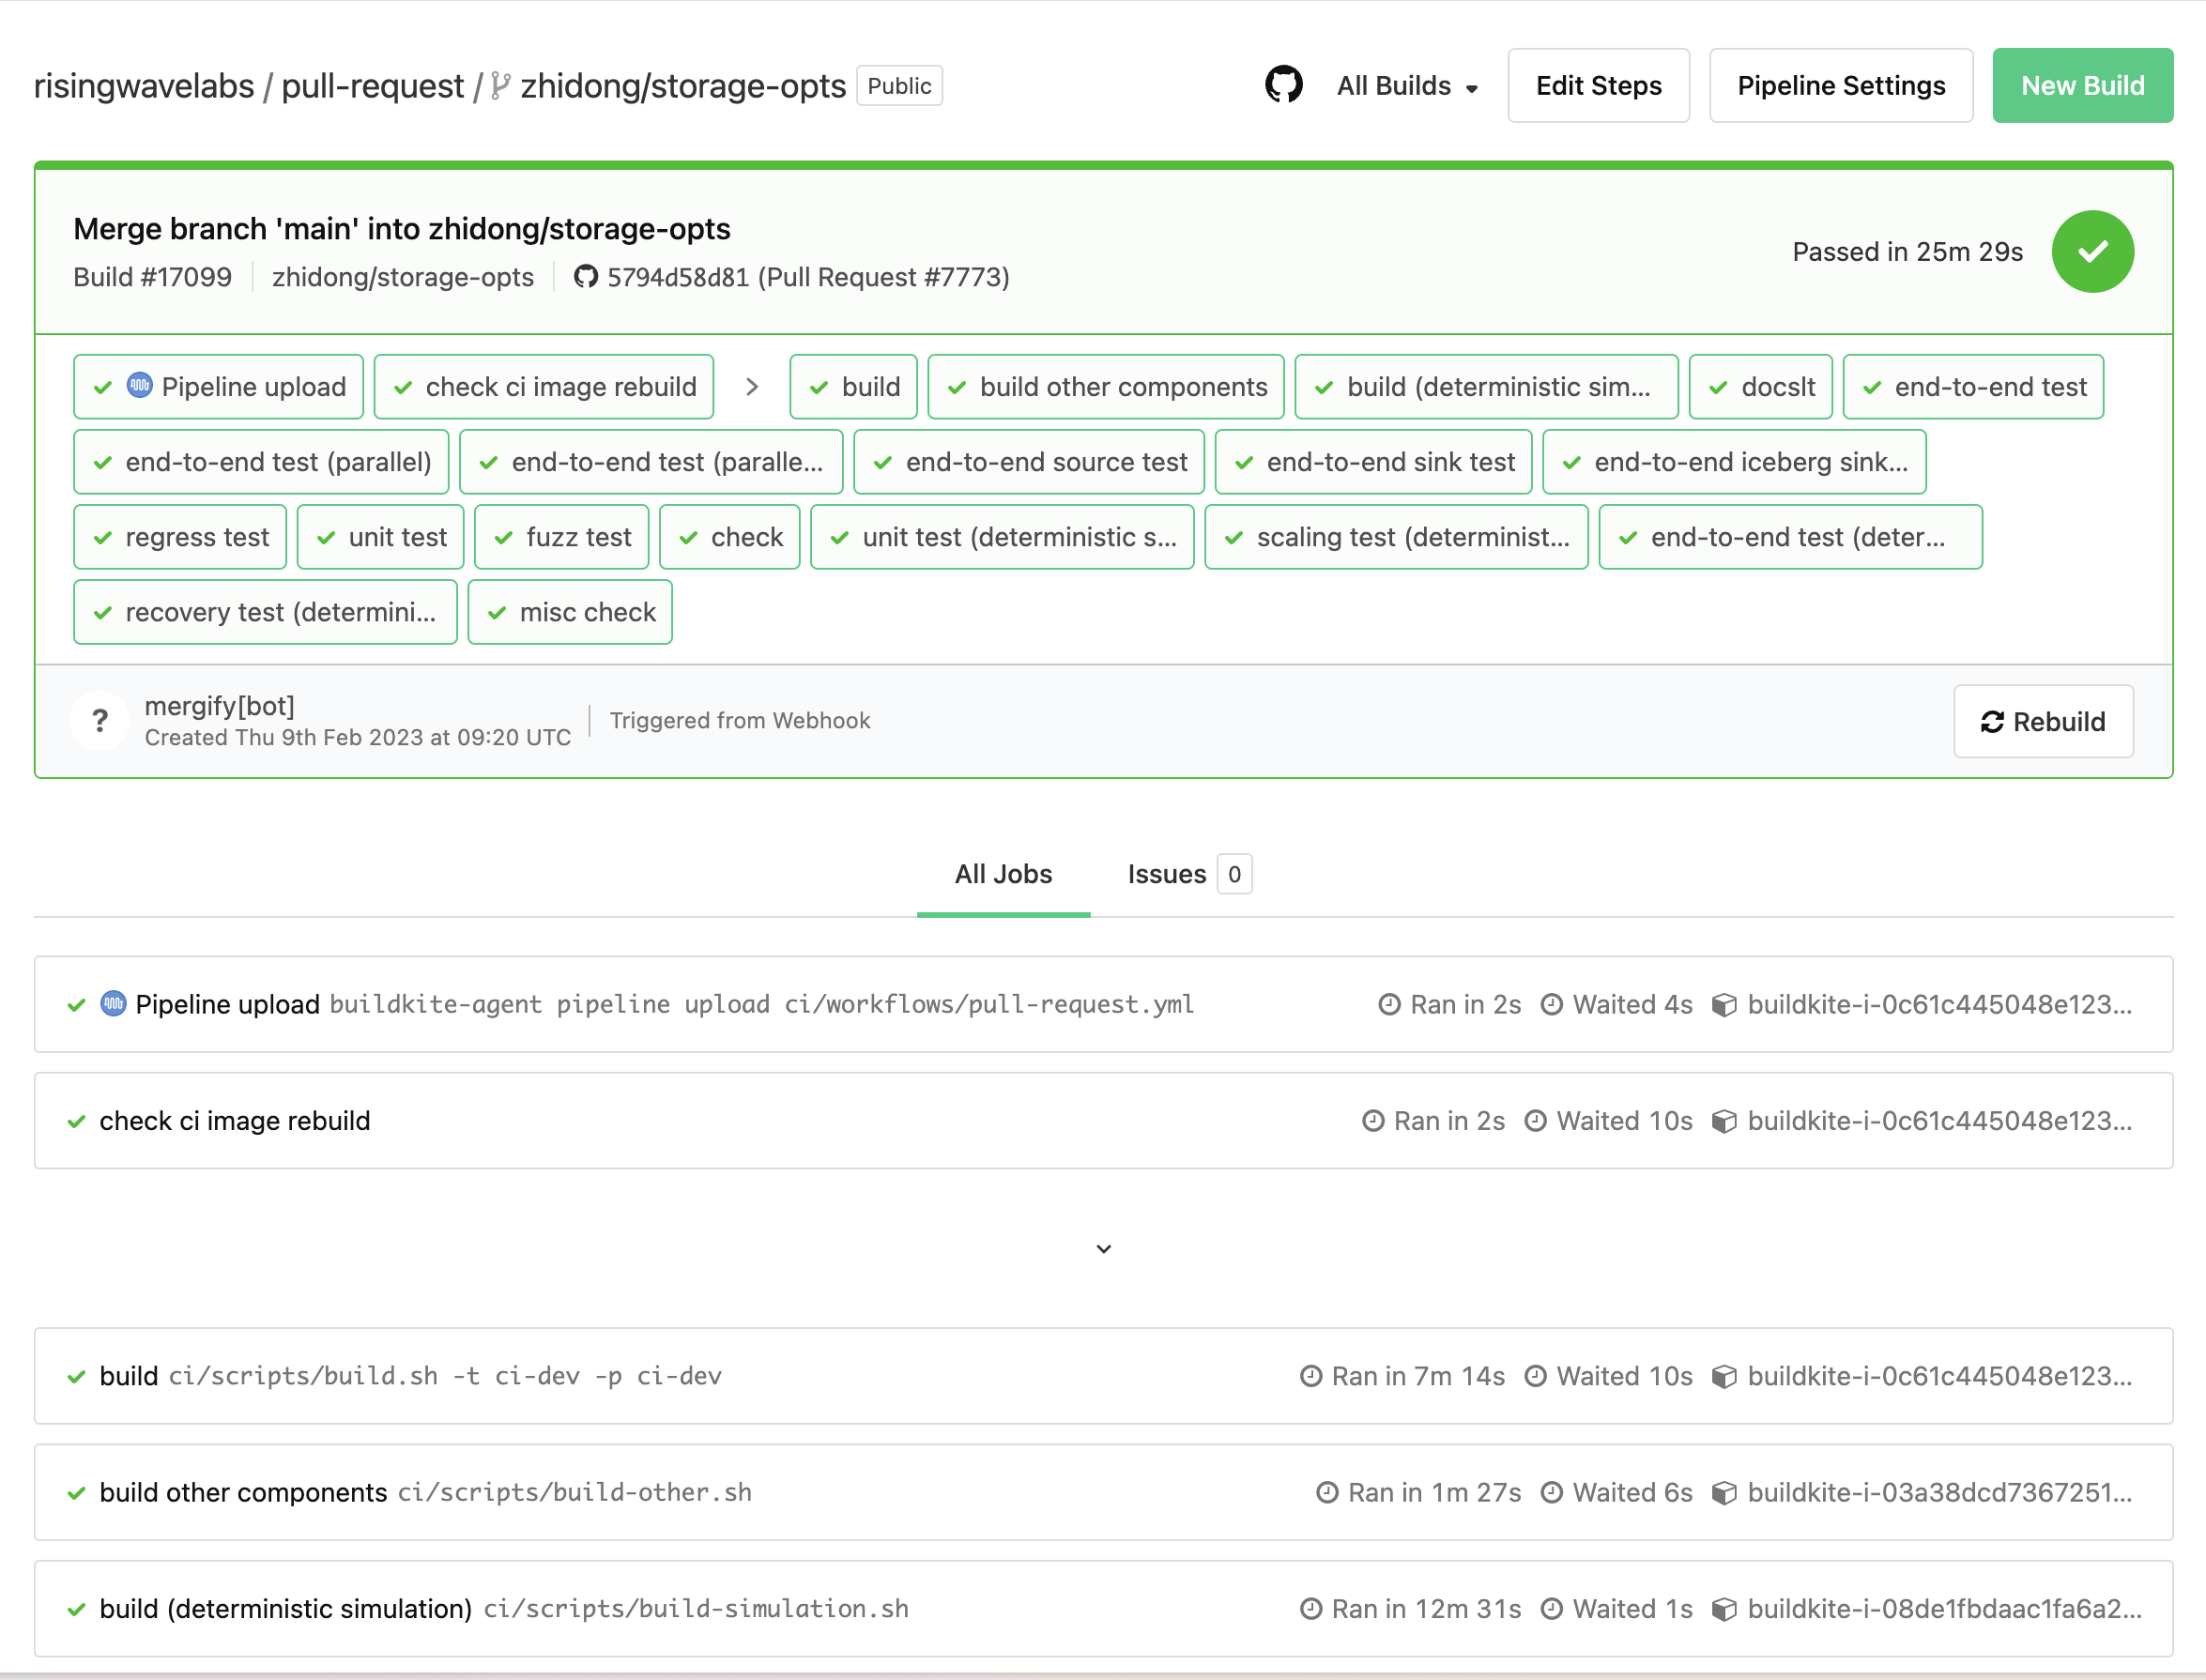
Buildkite has two very useful hidden pages, located at /waterfall and /dag, respectively, which show:
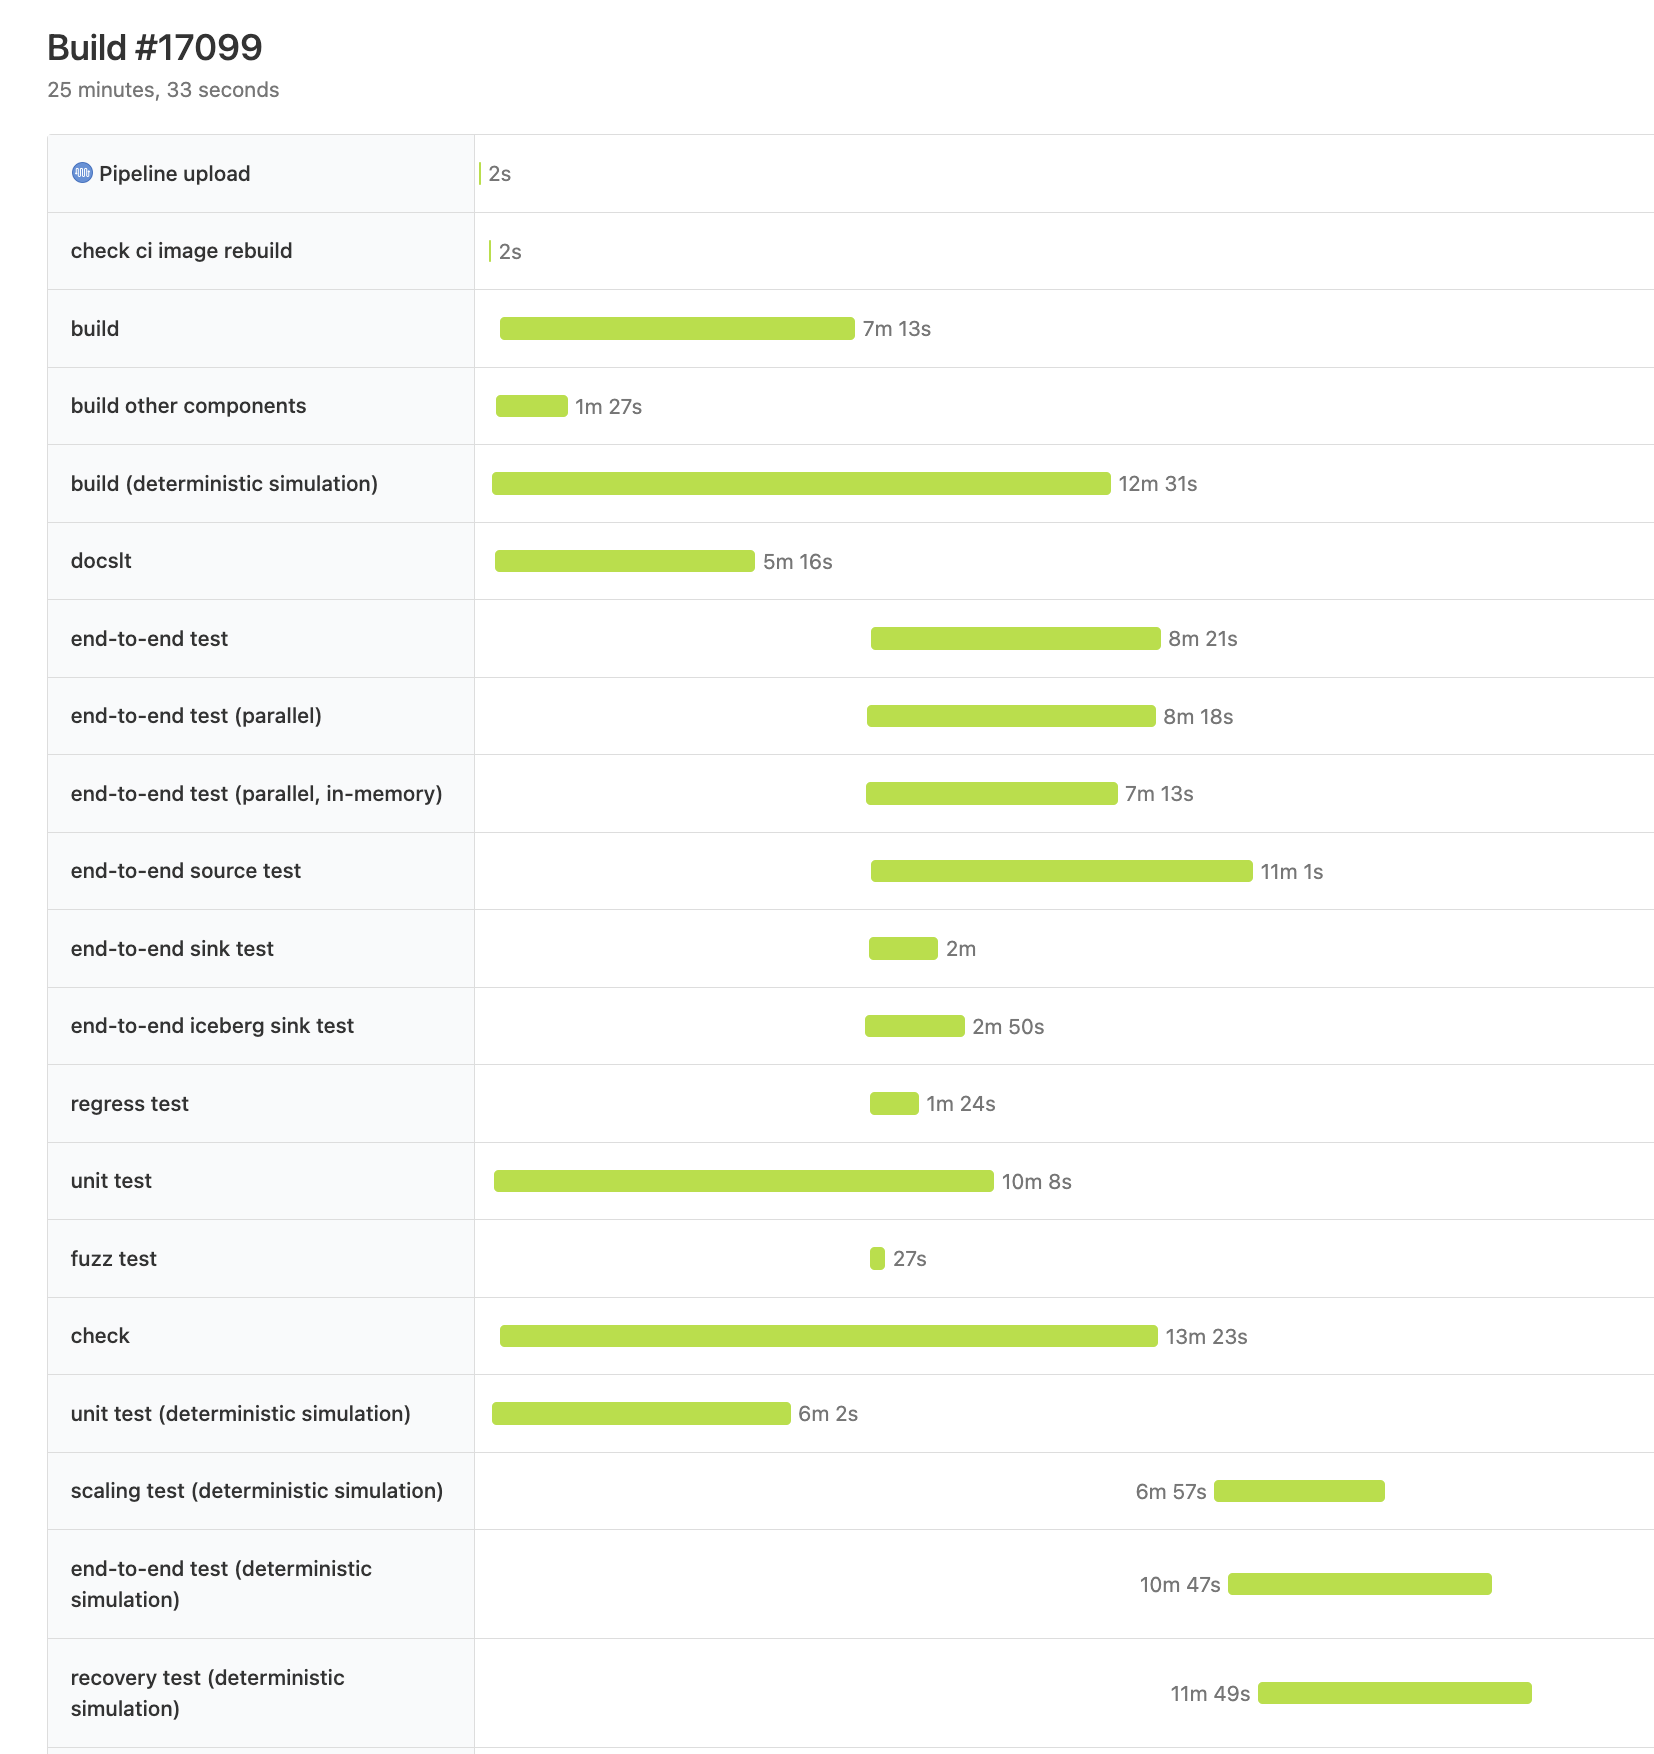
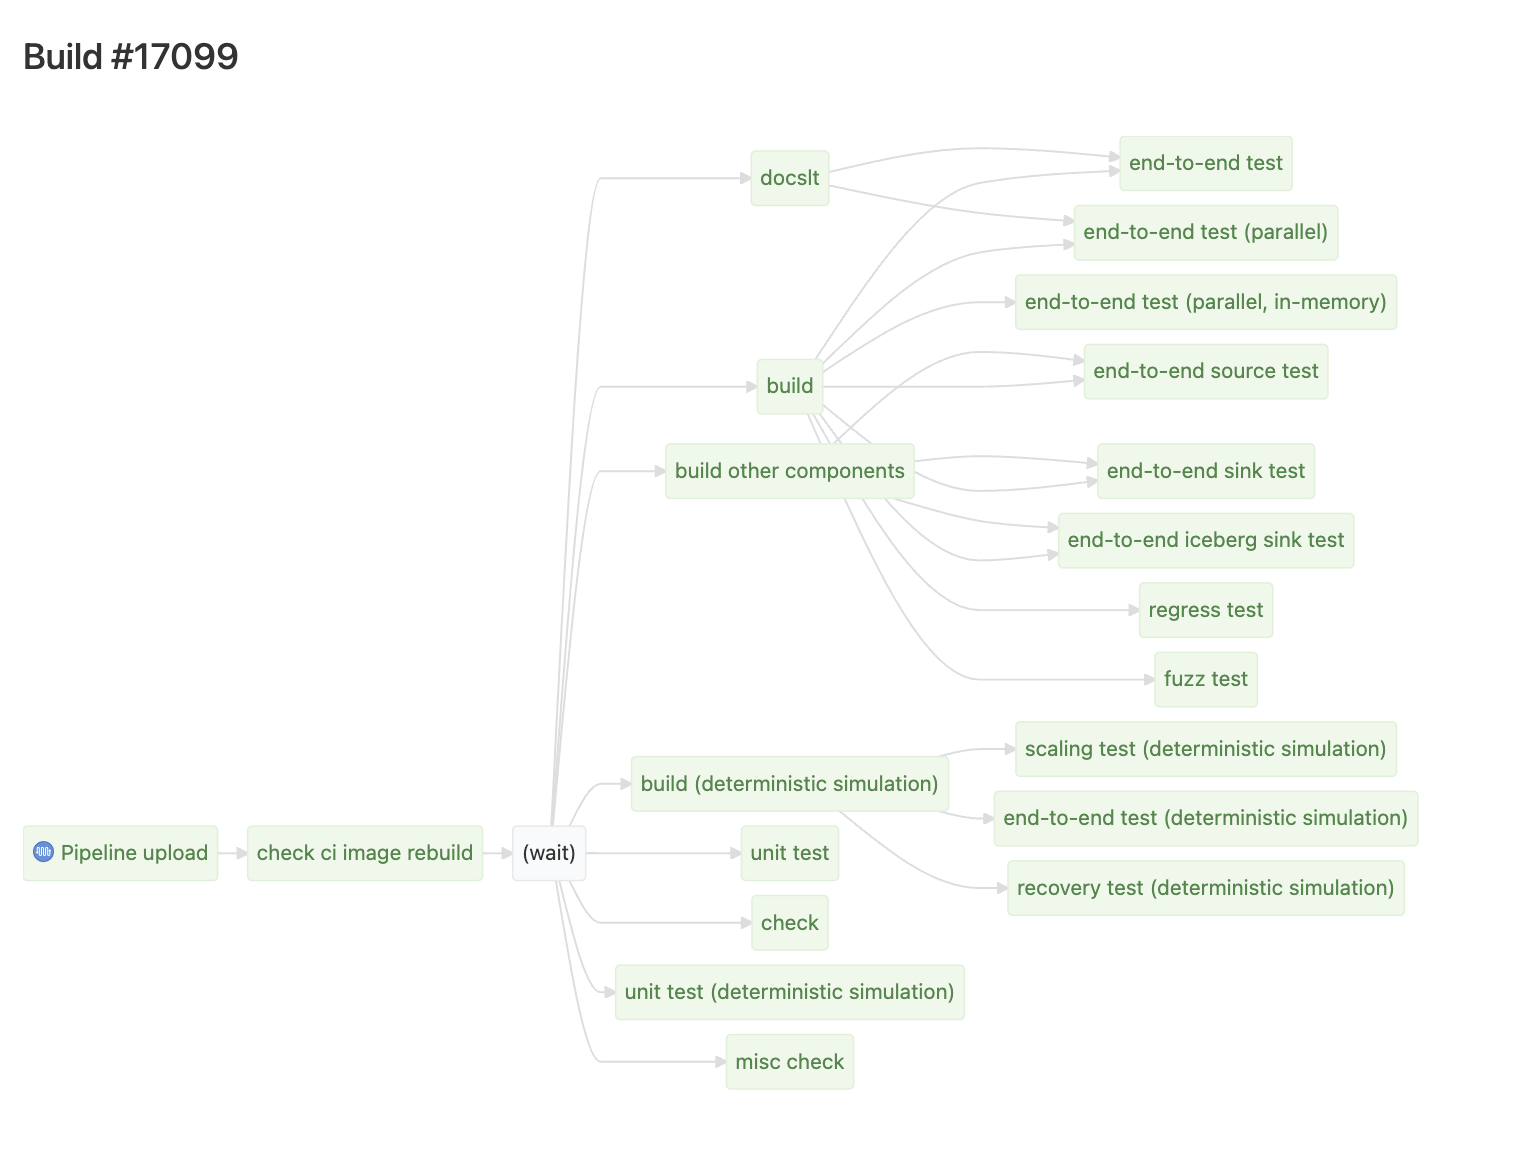
From the waferfall graph, we can see recovery test finishes last. Two large steps finish before it: build (deterministic simulation) and check. The DAG graph shows that recovery test depends only on simulation build, so we can forget about the check step for now, and conclude the biggest bottleneck is in the path of simulation build -> recovery test.
cargo build --timings
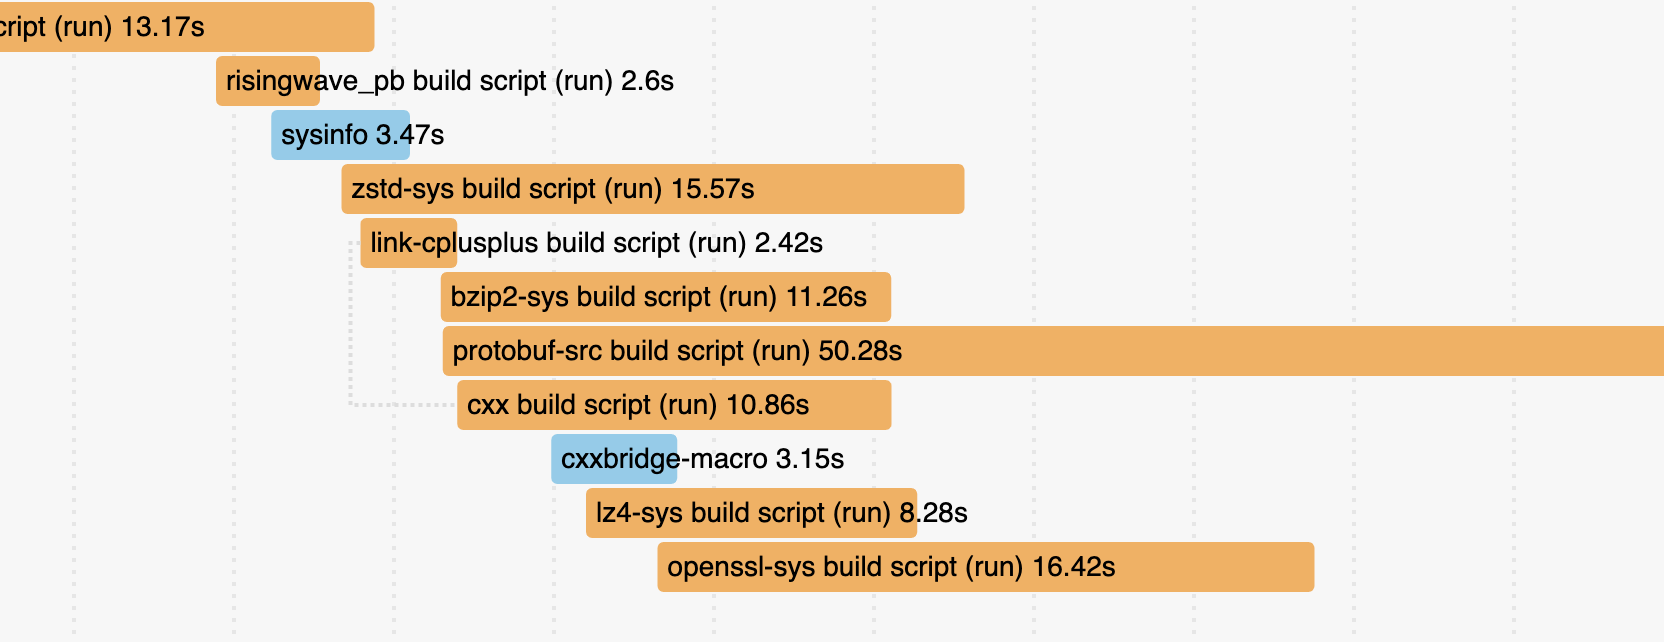
Cargo comes with built-in support for profiling build times (it was stabilized last year), which can be enabled by running cargo build --timings. It produces output like this:
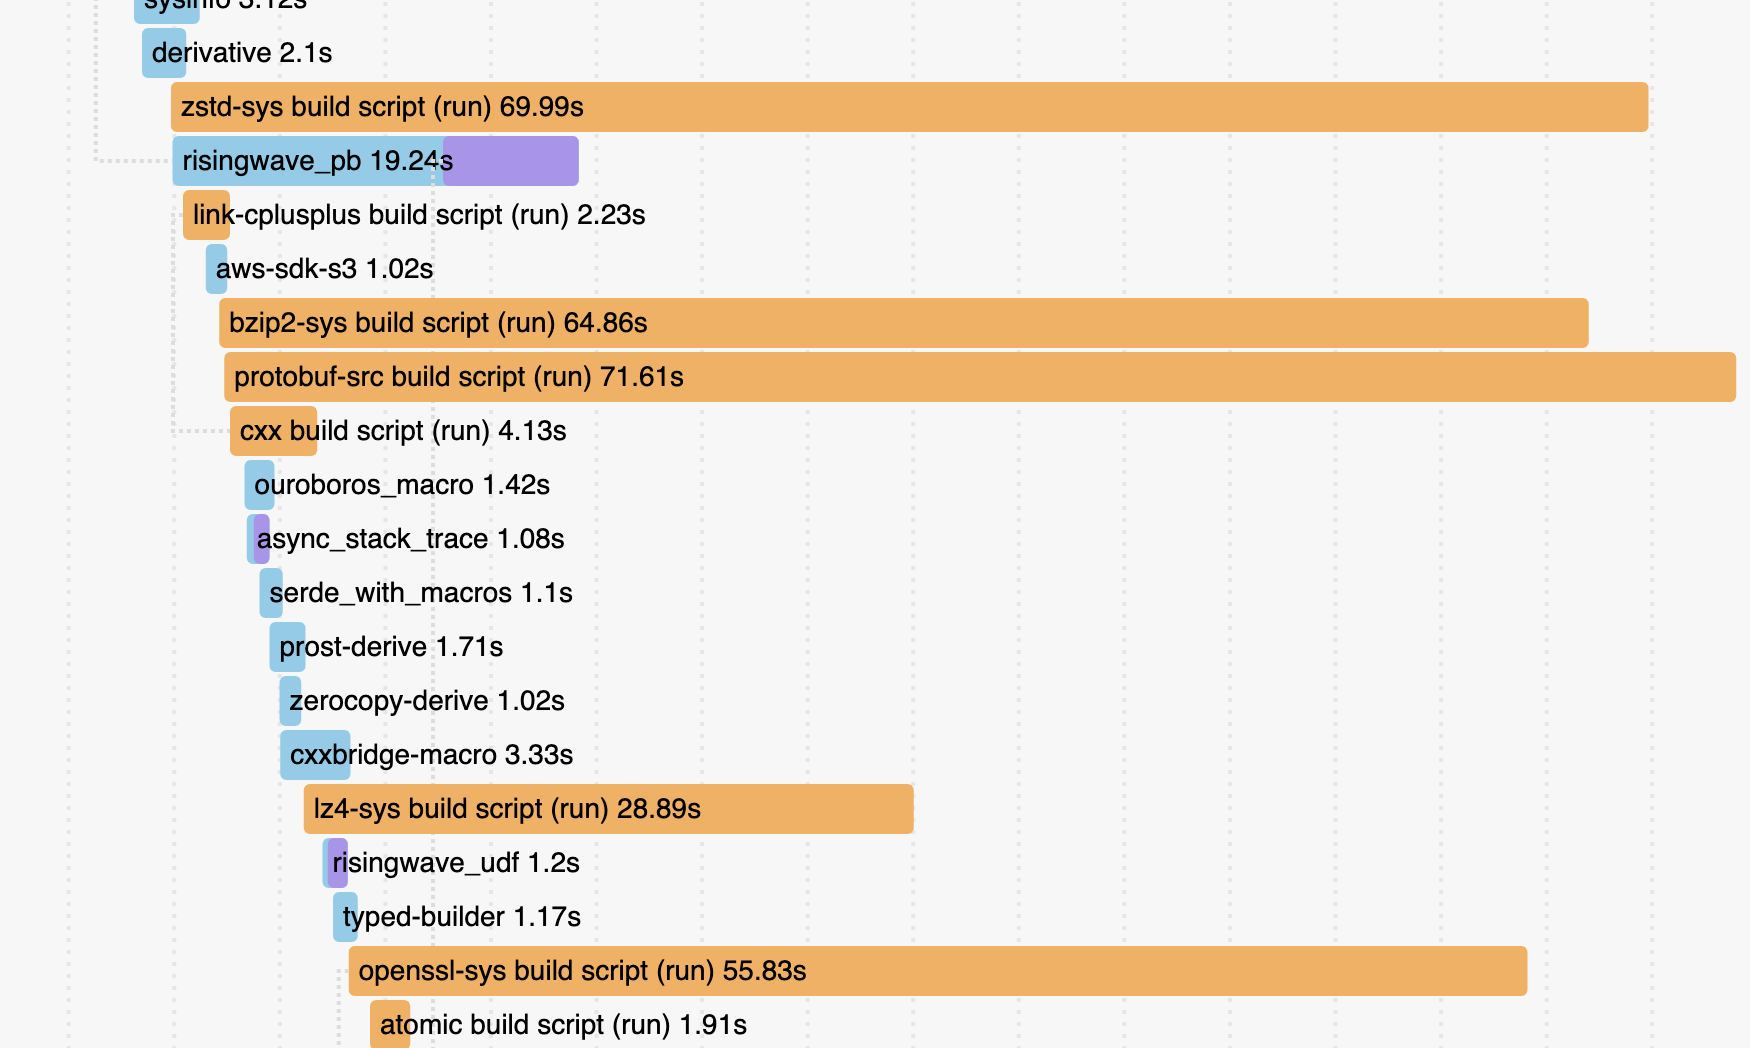
We can see that the compilation times for some dependencies such as zstd-sys and protobuf-src are very long, so we should try to optimize them.
Step 1: Compilation cache
If you think about it, it’s pretty obvious how a good caching strategy for CI should work.
Unfortunately, almost nobody does this.
Why should you give Sccache a try? With xuanwo’s strong recommendation, I was very tempted to try sccache, which was also a major trigger for my optimization efforts this time.
It’s so easy to use. Just add two environment variables to start it up:
ENV RUSTC_WRAPPER=sccache
ENV SCCACHE_BUCKET=ci-sccache-bucket
(Well, behind the scenes, you actually need to study Buildkite and AWS configurations - which are also very simple. Buildkite can obtain permissions through IAM roles, so I just need to a policy for the role to access an S3 bucket, without the need to configure things like secret keys. I had been thinking about whether I could echo the key out in CI before, but it seems there’s no need to worry about that. 😄)
The effect was immediately apparent, reducing the simulation build time by 2.5 minutes and the non-bottleneck debug build time by 4 minutes. Although it didn’t bring about a qualitative change, why not make use of the (almost free) quantitative change?
Step 2: Remove unused dependencies
build: remove unused deps #7816
All dependencies declared in Cargo.toml will be compiled regardless of whether they are actually used or not. Moreover, they may introduce unnecessary synchronization points, affecting the parallelism of compilation.
An old tool cargo-udeps is used to remove unused dependencies. But firstly, it does not support automatic fixing, and it is also very slow. Also, I had an impression that it cannot be used together with workspace-hack. This has led to RisingWave not cleaning up unused dependencies for a long time – a typical broken window effect 🥲!
In an issue of cargo-udeps about automatic fix, someone mentioned cargo-machete. Without many investigation I just gave it a shot, hoping it works. It turned out to be very fast and there were not many false positives! Although there were a few small problems (see the commit history of the above PR), they were easily fixed.
The author of cargo-machete has a blog introducing the harm of unused dependencies and the solution of cargo-machete. Specifically, cargo-udeps first compiles the project via cargo check and then analyzes it, while cargo-machete uses a simple and stupid approach: just ripgrep it.
This PR immediately removed dozens of unused dependencies, which surprised me again 🤯. Unfortunately, the CI time did not decrease further, which seems to indicate that sccache works very well… I roughly tested it locally, and it was faster by about ten to twenty seconds. It seems not a thing, but anyway it’s free :)
P.S. In fact, cargo-udeps can also be used with workspace-hack by configuring it: feat(risedev): add check-udeps #7836
Step 3: Disable incremental compilation
build: disable incremental build in CI #7838
After finishing the previous two steps, I almost wanted to finish my work, but I still felt a bit itchy and thought that the simulation build was still a little slow. So I decided to do some profiling. Then I saw the monsters in the --timings graph that I posted above. I felt that it didn’t make sense.
I tried to search the possible reasons why the build artifacts can be non-cacheable for sccache, and found that incremental compilation is a big caveat. I tried to disable it immediately and was shocked again. The effect was stupidly good:
This instantly reduced the time for simulation build by 4 minutes…
Actually, we turned off incremental compilation for our debug build a long time ago:
[profile.ci-dev]
incremental = false
But when we added a new build profile ci-sim later, we didn’t consider this issue. If you think about it, you can find although incremental compilation is good, it doesn’t make sense in CI!
CI builds often are closer to from-scratch builds, as changes are typically much bigger than from a local edit-compile cycle. For from-scratch builds, incremental adds an extra dependency-tracking overhead. It also significantly increases the amount of IO and the size of
./target, which make caching less effective.
So I simply added a global env var in CI to turn it off once and for all.
ENV CARGO_INCREMENTAL=0
Step 4: Single binary integration test
build: single-binary integration test #7842
It’s another stupidly effective optimization. tl;dr:
Don’t do this:
tests/
  foo.rs
  bar.rs
Do this instead:
tests/
  integration/
    main.rs
    foo.rs
    bar.rs
It’s because every file under tests/ will be compiled into a separate binary (meaning every one will link dependencies). Apart from slow compilation, this can even slow down test runnings (a flaw in cargo test).
This optimization didn’t reduce our test time (probably due to the superiority of cargo nextest), but it immediately reduced the compilation time by another 2 minutes… It’s also a bit funny that it also reduced the time for uploading/downloading, compressing/decompressing artifacts by 2 minutes…(although the latter did not affect the bottleneck).
Some previous efforts
The above is the main process of my optimization this time, and now I can finally be satisfied with the work. Finally, I would like to summarize some of our previous efforts for reference.
- Use
cargo nextestinstead ofcargo test. - Use the
workspace-hacktechnique: seecargo hakari. - Add cache to the cargo registry, or use the recently stabilized sparse index.
- Split a huge crate into multiple smaller crates.
- Try to reduce linking time: linking takes a lot of time and is single-threaded, so it may probably become a bottleneck.
- Use a faster linker:
moldfor Linux,zldfor macOS.lldis the most mature option for production use. - Turn off Link Time Optimization (LTO) on debug builds.
- Use a faster linker:
- Trade-off between compile time and performance: The total time of CI is compile time + test time, so whether to turn on compile optimization (including LTO mentioned above), and how much to turn on, is actually a trade-off between the two. You can test and adjust that in order to achieve an overall optimal choice. For example, here’s our build profile tuned by BugenZhao:
# The profile used for CI in pull requests.
# External dependencies are built with optimization enabled, while crates in this workspace are built
# with `dev` profile and full debug info. This is a trade-off between build time and e2e test time.
[profile.ci-dev]
inherits = "dev"
incremental = false
[profile.ci-dev.package."*"] # external dependencies
opt-level = 1
[profile.ci-dev.package."tokio"]
opt-level = 3
[profile.ci-dev.package."async_stack_trace"]
opt-level = 3
[profile.ci-dev.package."indextree"]
opt-level = 3
[profile.ci-dev.package."task_stats_alloc"]
opt-level = 3

# The profile used for deterministic simulation tests in CI.
# The simulator can only run single-threaded, so optimization is required to make the running time
# reasonable. The optimization level is customized to speed up the build.
[profile.ci-sim]
inherits = "dev"
opt-level = 2
incremental = false
For more optimization techniques, you may refer to other posts like Tips for Faster Rust Compile Times.
Conclusion
Things like CI and DX are easy to become messy if they are not taken care of regularly. My story shows that if you do some maintenance from time to time, you may get unexpected gains. A little effort can bring huge improvements.
Finally I’d like to quote matklad’s blog again as a conclusion:
Compilation time is a multiplier for basically everything. Whether you want to ship more features, to make code faster, to adapt to a change of requirements, or to attract new contributors, build time is a factor in that.
It also is a non-linear factor. Just waiting for the compiler is the smaller problem. The big one is losing the state of the flow or (worse) mental context switch to do something else while the code is compiling. One minute of work for the compiler wastes more than one minute of work for the human.
Let’s take some time to prevent “broken windows”. The effort would pay off!